Predictive Analytics
Predictive Analytics: From Historical Patterns to Production Forecasts Most analytics tools tell you what already happened. Predictive analytics is different in kind, not just…

1
Technologies
0
Services
Predictive Analytics: From Historical Patterns to Production Forecasts
Most analytics tools tell you what already happened. Predictive analytics is different in kind, not just degree — it uses historical patterns to forecast what hasn't happened yet: which customer will churn, what demand will look like next quarter, which transaction is fraudulent before it clears. That shift, from describing the past to forecasting the future, is what separates a dashboard from a prediction.
The core pipeline
A predictive model starts with historical data — past outcomes, labeled with what actually happened. Feature engineering turns raw historical records into the inputs a model can learn from: a purchase history becomes "days since last order," a sensor log becomes "rate of change over the last hour." The model is trained on that data, validated against a holdout set it never saw, and then deployed to score new data as it arrives. That's not the end of the pipeline — production models are monitored continuously, because a model's accuracy on the data it was trained on says nothing about how it'll hold up as the world it's predicting keeps changing.
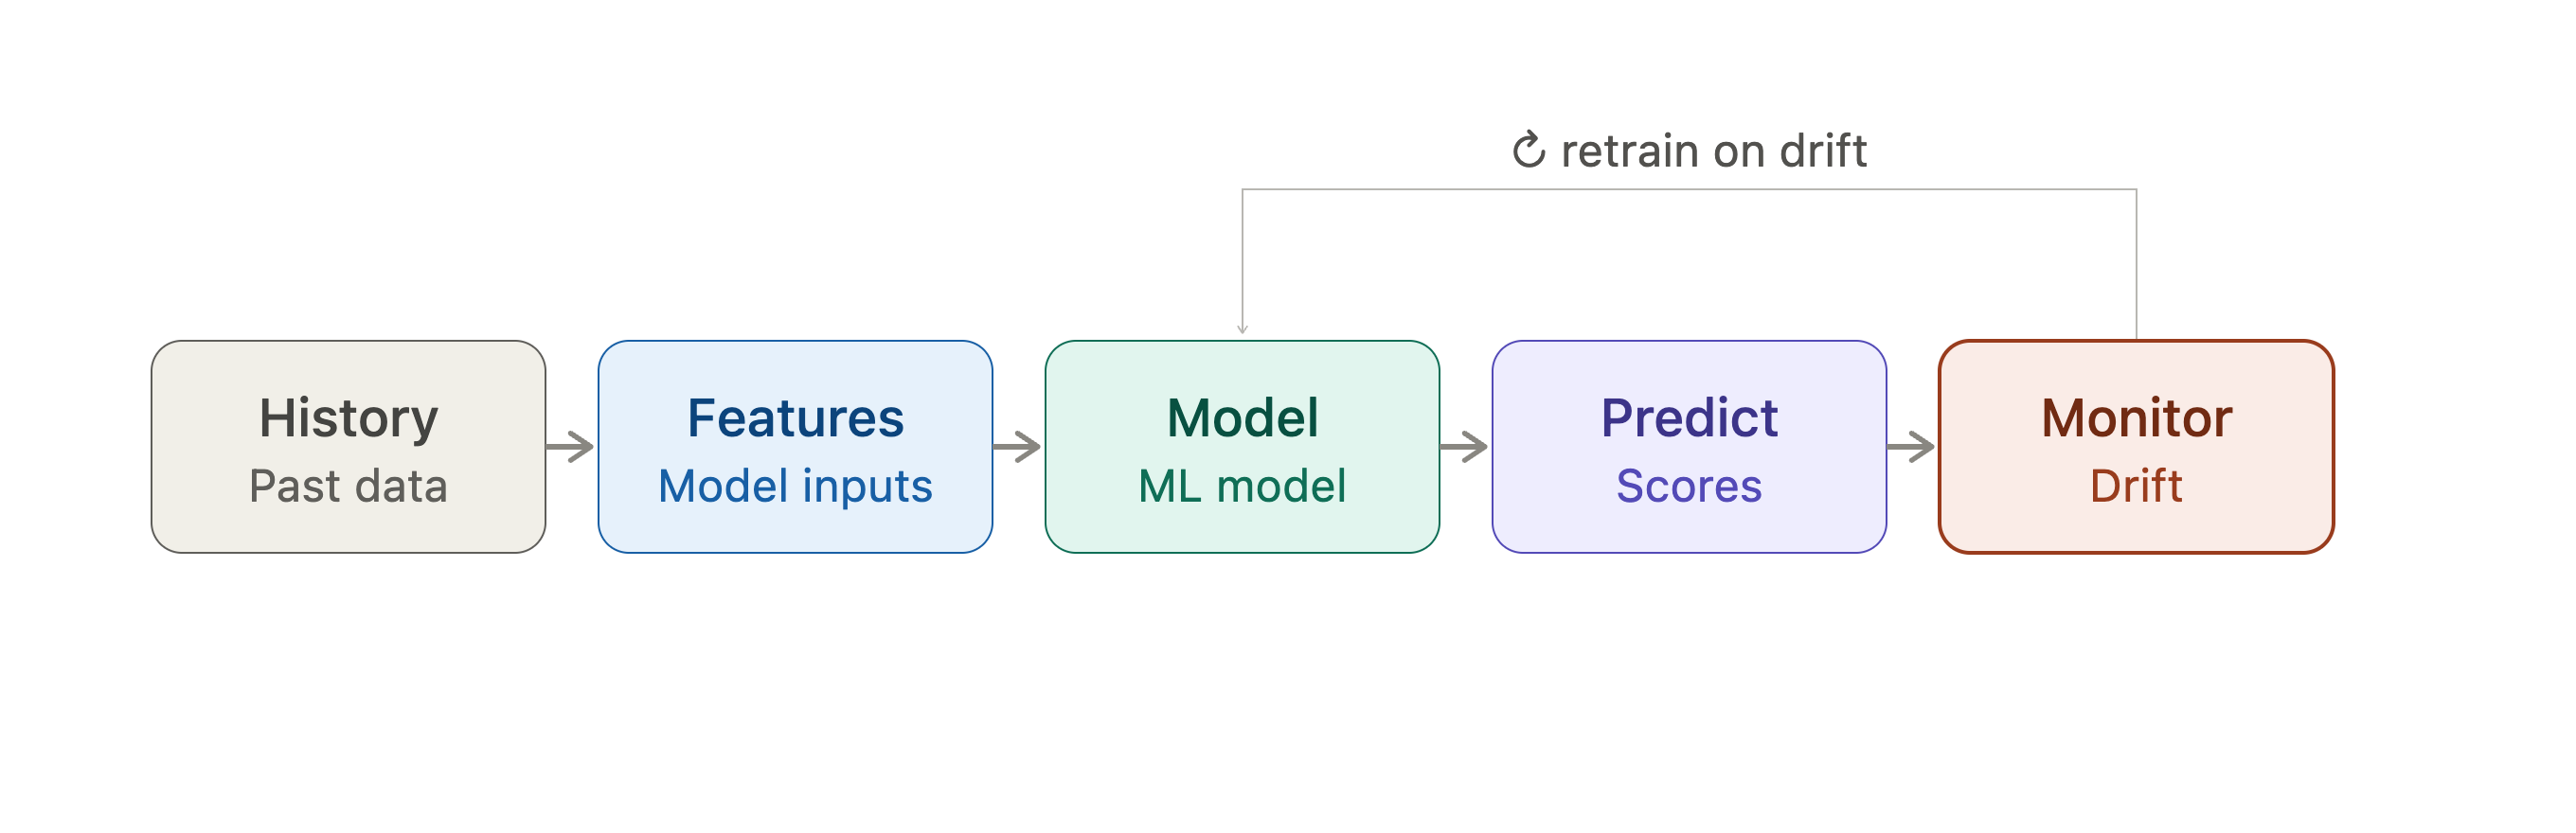
Diagram to source: a 5-stage pipeline (History → Features → Model → Predict → Monitor) with a labeled return arrow from Monitor back to Model ("retrain on drift"). A live reference version was rendered during planning — use it as the design spec for a commissioned or licensed final asset, then host it through your own media library.
The core problem types, compared
| Problem type | Predicts | Typical output | Typical use case |
|---|---|---|---|
| Classification | Will this happen? | A category or probability | Churn prediction, fraud flagging |
| Regression | How much, or how many? | A continuous number | Revenue forecasting, demand sizing |
| Time-series forecasting | What's the future trend? | A sequence of future values | Inventory planning, capacity forecasting |
| Anomaly detection | Is this unusual? | An outlier score or flag | Fraud detection, equipment failure prediction |
Scroll to see more →
Will this happen — classification, a yes/no or probability-of-class answer.
How much, or when — regression, a specific number rather than a category.
What's the future trend — time-series forecasting, a sequence rather than a single value.
Is this unusual — anomaly detection, flagging what doesn't fit the learned pattern.
Model families and the accuracy/interpretability trade-off
This is usually the second decision, right after choosing the problem type, and it's where a lot of production projects stall — not because the model isn't accurate enough, but because nobody can explain why it made a given prediction when a regulator, auditor, or customer asks.
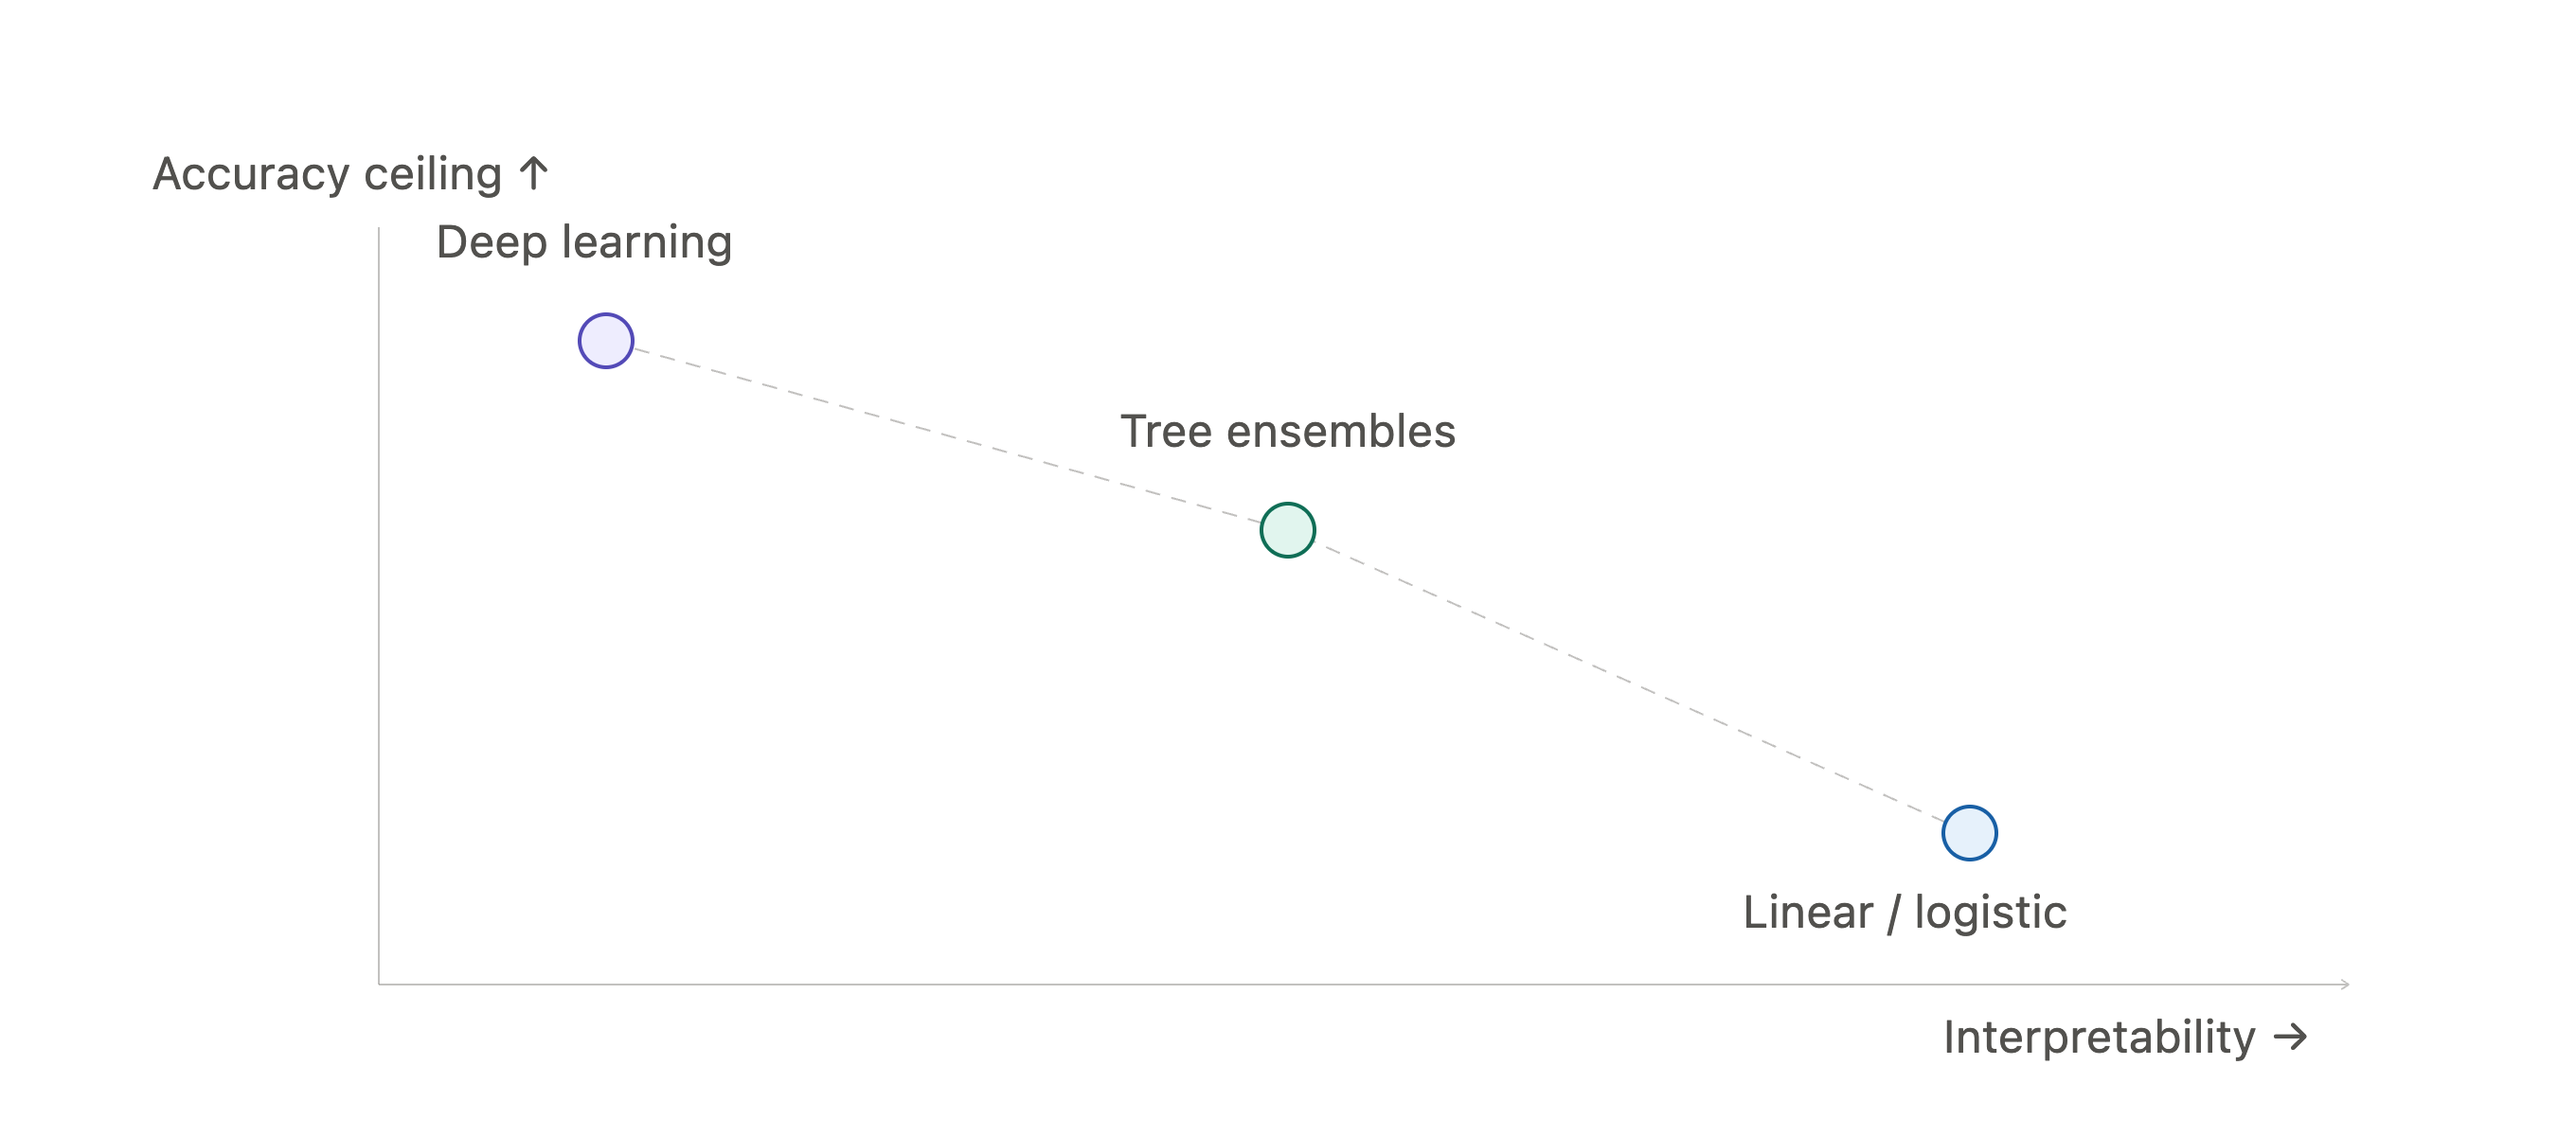
Diagram to source: a simple two-axis scatter (interpretability vs. accuracy ceiling) with the three model families plotted along a downward trend. A live reference version was rendered during planning.
| Model family | Interpretability | Data requirements | Accuracy ceiling |
|---|---|---|---|
| Linear / logistic regression | High — coefficients are directly explainable | Low — works with modest datasets | Lower, especially on nonlinear patterns |
| Tree ensembles (XGBoost, random forest) | Medium — feature importance, not full transparency | Medium | High on structured/tabular data |
| Deep learning | Low — effectively a black box without extra tooling | High — needs large labeled datasets | Highest, especially on unstructured data |
Scroll to see more →
What enterprise-grade predictive analytics actually requires
Explainability for regulated decisions — credit, hiring, and insurance predictions often carry a legal requirement to explain why, not just what.
Scoring latency for real-time predictions — fraud detection at transaction time has a latency budget measured in milliseconds, not a nightly batch job.
Drift monitoring — tracking whether the live data distribution is still close to what the model was trained on, before accuracy visibly degrades.
Versioned retraining pipelines — so a prediction can be traced to exactly which model version, trained on which data snapshot, produced it.
Where Automex fits in
Automex runs the full loop — training, scoring, monitoring, and retraining — as one managed pipeline instead of a model handed off after the initial build. Drift detection and explainability tooling are part of the deployment, not something added after a model has already gone stale in production.
The full loop, not just training — scoring and monitoring run continuously, with retraining triggered by drift, not a calendar guess.
Explainability built in — predictions come with the reasoning regulated decisions require.
Real-time scoring — latency budgets designed for in-the-moment decisions like fraud checks, not just batch reports.
Evaluating a predictive analytics use case? Talk to us about an architecture review.
Technologies
(1)Interested in Predictive Analytics?
Let's discuss how this AI capability can address your specific business needs.